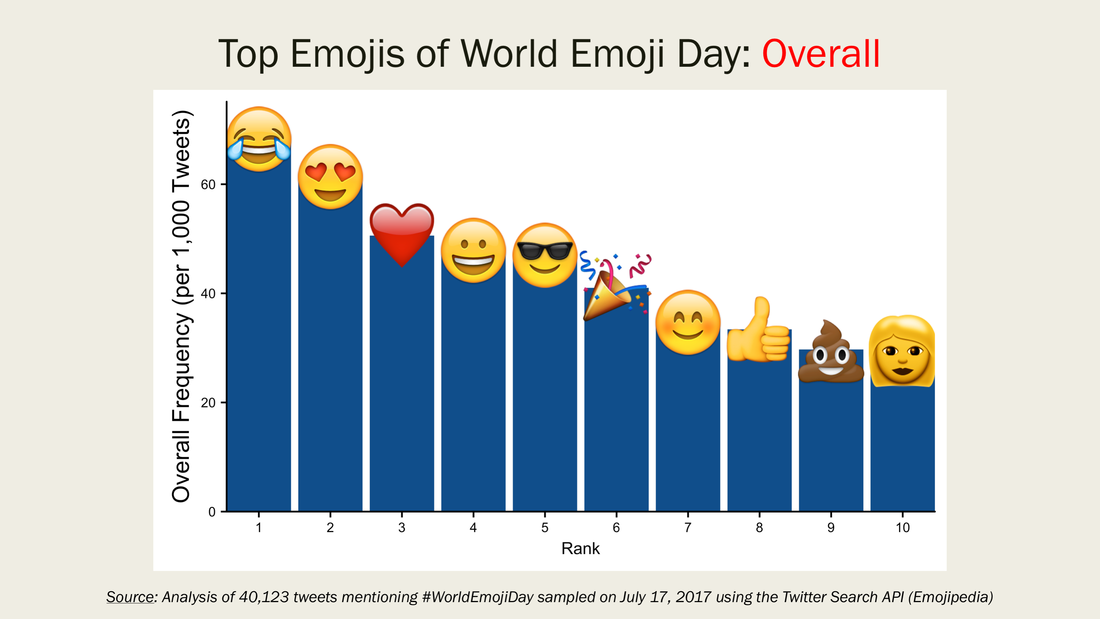
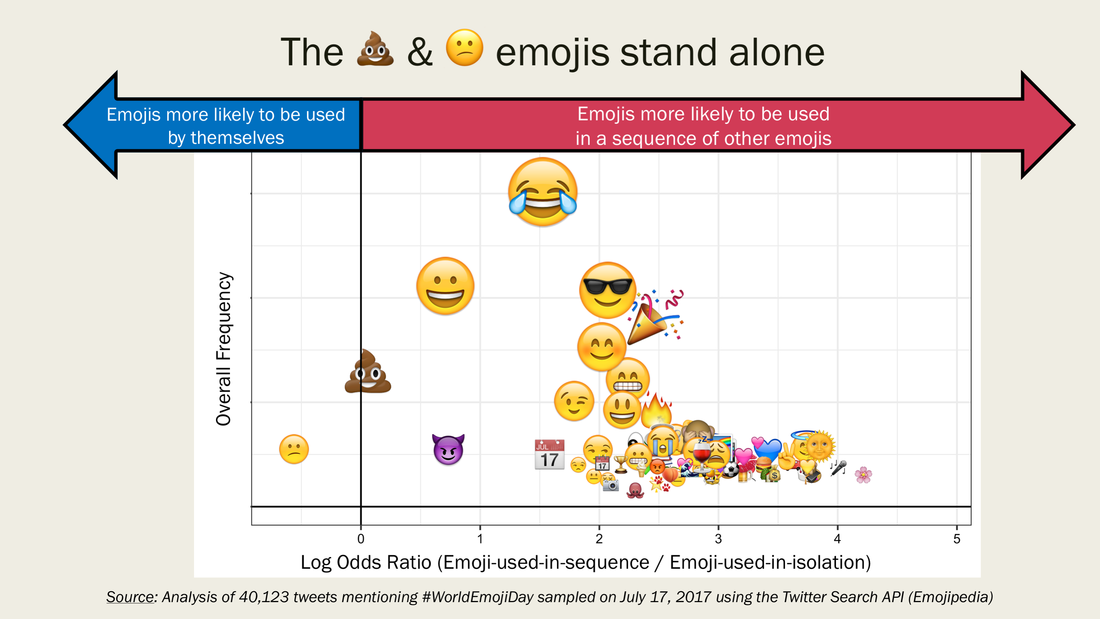
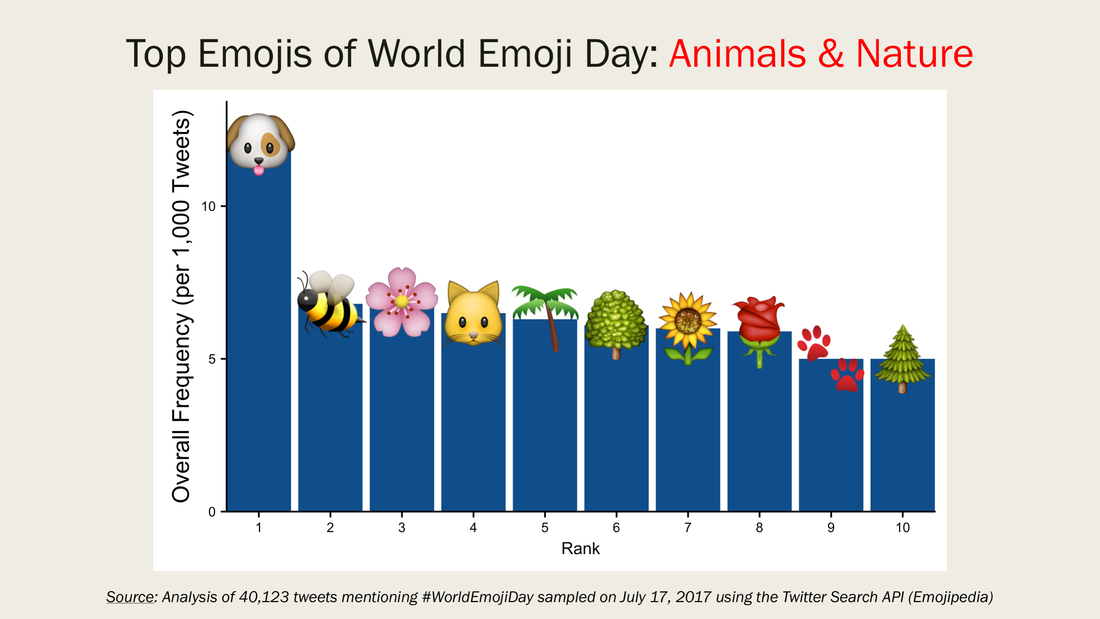
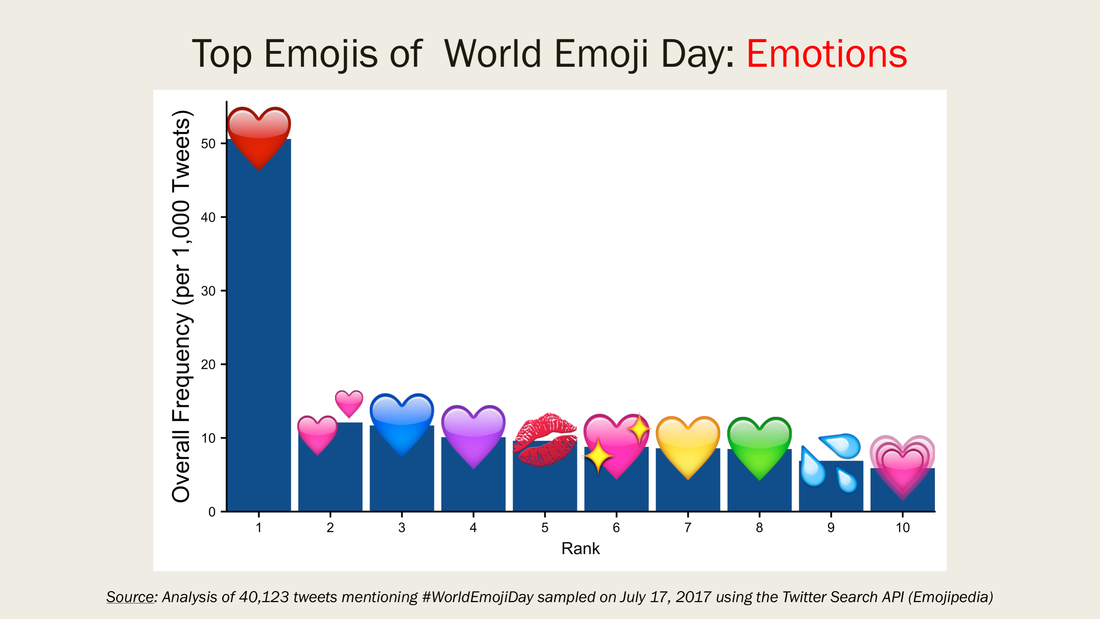
 A recent Emojipedia blog post has done an interesting job at trying to visualise data relating to the popularity of emojis on a particular day on a particular platform. This is clearly a complicated subject and would lead to interesting discussions in classes relating to sampling, data collection and presentation of data. The graph showing which emojis are used alone or together could be a good basis for discussing misleading graphs.
0 Comments
Leave a Reply. |
AuthorJohn Kennedy Archives
September 2018
Categories |


 RSS Feed
